
Turf Science & Safety Resource Hub:
Evidence on Player Health, Injuries & Performance
Decades of independent research, NFL player data, and biomechanical studies reveal consistent safety and performance advantages. Explore the evidence—and discover why POWERgrass™ hybrid turf delivers the best of both worlds.
At HTA Turfgrass, we believe decisions about playing surfaces should be driven by science, not marketing. This hub compiles primary sources on injury rates, health risks, heat, sustainability, and more. The volume of evidence is eye-opening—and it points toward safer, more durable solutions like FIFA-approved POWERgrass™ hybrid systems.
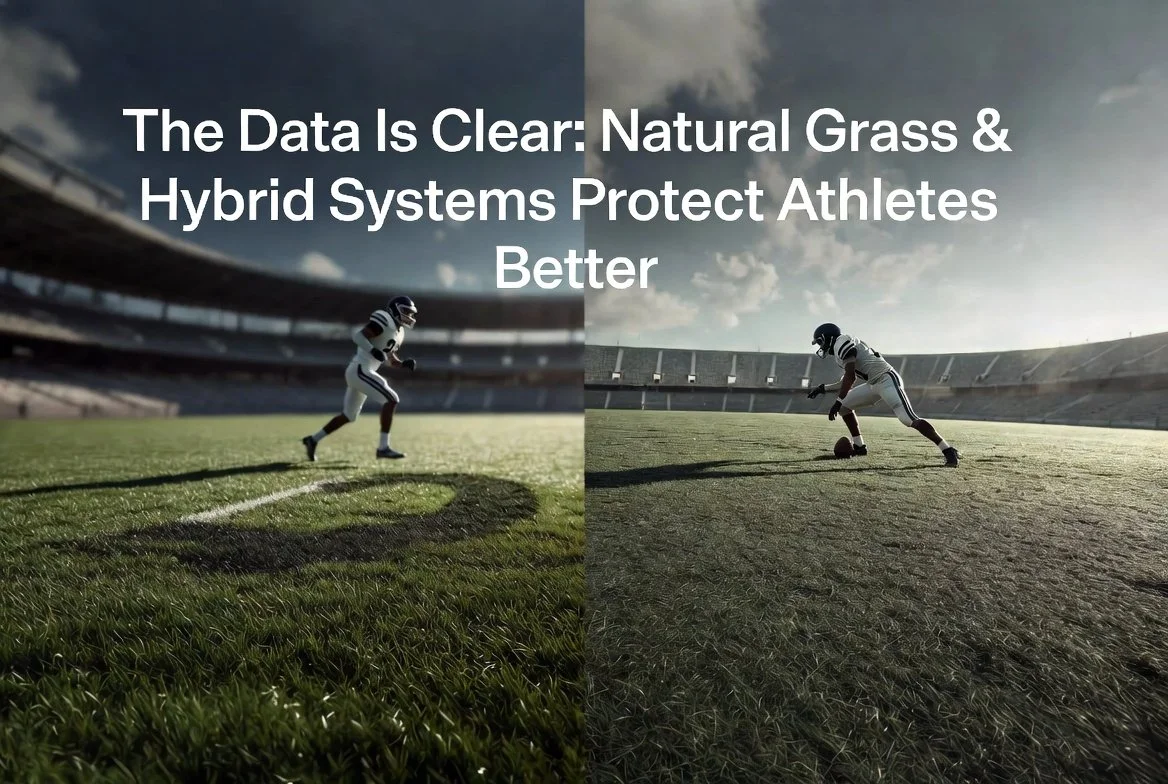
1. NFLPA Data & Player Voices
The NFL Players Association (NFLPA) has been a leading advocate based on league injury data and player feedback.
28% higher rate of non-contact lower extremity injuries on artificial turf vs. natural grass (NFL data 2012–2018).
Of those: 32% higher non-contact knee injuries and 69% higher non-contact foot/ankle injuries on turf.
Grass was significantly safer in 10 of 11 recent years (2021 was an outlier). ESPN
92% of NFL players prefer natural grass for safety and performance. Sportico
“The data supports the anecdotes you’ll hear from me and other players: artificial turf is significantly harder on the body than grass.” — NFLPA leadership.
Primary Source: NFLPA official posts (e.g., “Only Natural Grass Can Level The NFL’s Playing Field”). NFL Player's Association
2. Colorado State University (CSU) Research & Biomechanical Insights
Colorado State University’s Clinical Biomechanics Lab (led by Dr. Raoul Reiser) provides critical real-world data using force plates, high-speed cameras, motion capture, and wearable sensors.
Focuses on how surfaces affect traction, forces during cutting/pivoting, and injury risk.
Research shows more musculoskeletal injuries on artificial turf than natural grass; aims to optimize surfaces.
Ongoing work with IMUs in actual games to capture cutting/pivoting data.
“The research shows us that more musculoskeletal injuries are prevalent on artificial turf than on natural grass.” — Dr. Raoul Reiser, CSU. CSU Article
Hybrids like POWERgrass combine natural grass characteristics with added durability, aligning with CSU’s goal of better-performing surfaces.
Primary Source: National Library of Medicine - Lower Extremity Injury Rates on Artificial Turf Versus Natural Grass Playing Surfaces: A Systematic Review National Library of Medicine: Injury Rates
3. Fatigue, Pitches, & Injuries: The Perfect Storm in Soccer and How to Win in the Last 15 Minutes
https://www.youtube.com/watch?v=EyN8vwa_cDc
4. Key Peer-Reviewed Injury Studies
The body of evidence is substantial. Here’s a comprehensive overview (far from exhaustive—new studies emerge regularly).
Concussion Data:
Guskiewicz et al. (2000) – Epidemiology of Concussion in Collegiate and High School Football Players. This large nationwide study of over 17,500 players found that head-to-ground contact on artificial turf was disproportionately associated with concussions — and those on turf tended to be more serious than on grass, raising clear red flags for surface-related head injury risk. Link (SagePub)
Villanueva et al. (2024) – Impact Deceleration Differences on Natural Grass Versus Synthetic Turf. Biomechanical helmeted manikin drop testing on real high school fields showed significantly greater impact deceleration (higher g-forces) on synthetic turf versus natural grass across forward, backward, and side falls — forces directly linked to elevated concussion risk from player-to-surface contact. Link (PMC)
Chun et al. (2022) – Presented at American Academy of Pediatrics. High-volume mannequin testing revealed impact deceleration up to 23g higher on artificial turf compared to natural grass, translating to a theoretical increased concussion risk due to the harder surface response — a concern that grows as fields age. Summary/Discussion
Center for Research on Artificial Turf Injuries & Gmax Hardness Reports. Reviews of multiple datasets (including Guskiewicz) confirm artificial turf’s association with more serious concussions from ground contact, compounded by real-world maintenance gaps where Gmax hardness rises over the field’s lifecycle, pushing surfaces into higher-risk territory without proper (and often neglected) upkeep. Link (Center4Research)
Artificial turf hardness, measured by Gmax, increases significantly as fields age due to infill compaction, migration, breakdown, and inconsistent maintenance. While new artificial turf fields start within the recommended 165 Gmax, values rise steadily with use — especially in high-traffic areas — pushing many beyond the 165 threshold that signals increased injury risk.
POWERgrass and natural turf-grass typically maintains a much softer, more consistent 70–115 Gmax range. In contrast, compacted rubber infill hardens the surface, leading to higher forces on player-to-surface contact. Studies show trauma to the head, knee, and shoulder rises notably when infill levels drop below recommended weights, a common issue when “low-maintenance” artificial turf fields receive minimal upkeep.
NFL-Focused Highlights:
2024 Venishetty et al. (Orthopaedic Journal of Sports Medicine): 718 lower extremity injuries (2021–2022). Rate: 1.22 per game on grass vs. 1.42 on turf (~16.4% higher on turf). Season-ending surgery odds 60% higher on turf (OR 1.60). National Library of Medicine: NFL Data
2019 Mack et al. (AJSM): 16% more lower extremity injuries per play on synthetic turf (2012–2016). Estimated 300+ fewer foot/leg injuries league-wide if all games were on grass. Higher non-contact rates on turf. Sports Field Management
2016–2021 NFL database: Every common lower extremity injury (ankle, hamstring, ACL, MCL, Achilles, fractures) more frequent on artificial surfaces (increases 2–62%). Matthew Provencher, MD
Broader Studies:
NCAA DII/DIII football: 1.63x higher ACL rates on turf; some analyses show nearly 3x higher PCL. Digital Commons Research
High school athletes: 58% higher overall injury risk on turf; lower extremity RR ~1.96.
Systematic reviews (e.g., Gould et al. 2023, AJSM): Higher foot/ankle injury rates on both old- and new-generation turf vs. grass. WashU Research
Key Studies at a Glance:
Venishetty et al. (2021–2022): 1.42 vs 1.22 lower extremity injuries/game (~16.4% higher on turf); 60% higher odds of season-ending surgery on turf Full Article (SAGE Journals) or PubMed
Mack et al. (2012–2016): 16% more lower extremity injuries per play on synthetic turf; ~300+ fewer injuries league-wide if all on grass PubMed / AJSM
NFLPA Official Data (2012–2018): 28% higher non-contact lower extremity injuries on turf; 32% higher knee, 69% higher foot/ankle NFLPA: Only Natural Grass Can Level The NFL’s Playing Field
Loughran et al. (2004–2014): Higher knee injury rates on turf (1.63x higher ACL in NCAA DII/DIII) PubMed
Gould et al. Systematic Review (Up to 2022): Higher foot & ankle injury rates on both old- and new-generation artificial turf vs. natural grass PubMed / AJSM
5. Heat, Chemicals & Broader Health Risks
European Union ban on microplastics includes artificial turf rubber infill. ACS Publications
Heat: Artificial turf surfaces often 20–50°F+ hotter (peaks >150–200°F); air temperatures elevated. Irrigation offers only temporary relief. Increases heat stress risk. NCCEH Research
PFAS & Chemicals: “Forever chemicals” in blades/backing; microplastics shed thousands of fibers daily (tons of infill annually). Runoff contaminates water/soil. Linked to long-term health concerns. NCCEH Research
Injuries on turf are often more severe with longer recovery. National Center for Health Research
6. Environmental & Sustainability Data
Natural/hybrid: Better permeability, lower urban heat, carbon sequestration, biodiversity.
Artificial: Higher lifecycle costs, disposal issues, microplastic pollution, reduced stormwater management.
Key Studies at a Glance:
Cumberbatch et al. (2025): Comprehensive life-cycle comparison showing artificial turf has significantly higher GHG emissions, microplastic pollution, poor permeability, and PFAS concerns. Artificial turf measured ~24.1°C hotter than natural grass. Natural grass/hybrids recommended for sustainability. Full Paper (Open Access - MDPI)
National Collaborating Centre for Environmental Health (NCCEH) Review: Artificial turf linked to microplastics, chemical runoff (PFAS, metals, PAHs), reduced stormwater permeability, and contribution to urban heat islands. Natural and hybrid systems perform better for biodiversity and environmental health. Evidence Review
Mount Sinai Children’s Environmental Health Center (2025): Artificial turf is a major source of microplastics (~2 tons infill/year + 20,000 fibers/day per field) and contains PFAS that contaminate soil and groundwater. Strongly recommends natural grass. Position Statement
Russo et al. (2022): Life-cycle analysis using Product Environmental Footprint method. Artificial turf can have comparable or better impacts at extremely high usage intensity, but natural/hybrid systems are generally preferable for moderate use due to lower overall environmental trade-offs. Journal of Environmental Management
New Jersey DEP Synthetic Turf Science Review (2025): Detailed assessment of microplastics, chemical leaching, and end-of-life disposal issues. Highlights synthetic turf as a significant contributor to microplastic pollution. NJDEP Report (PDF)
Verona Township / PSEG Institute Case Study (2024): 61-page analysis concluded natural grass was superior for environmental impact, heat reduction, chemical concerns, and 25-year total costs. Full Report (PDF)
7. Artificial Turf Maintenance
FieldTurf Maintenance LINK
FieldTurf publishes detailed Maintenance Guidelines (Owner’s Manual) PDFs with recommended frequencies. They use a simple “BARS” framework:
Brushing — Every 4–6 weeks (rejuvenates fibers and levels infill).
Aerating — Maximum 2–3 times per year (starting in year 2; loosens compacted infill).
Raking — Every 4–6 weeks (prevents matting and loosens infill).
Sweeping — As needed (removes debris).
Additional recommendations:
Infill top-dressing/replenishment in high-traffic areas (as needed; often part of professional service visits).
Gmax (surface hardness) testing — Recommended annually or during professional service visits (per ASTM standards).
They offer a FieldCare professional maintenance program with written reports.
Sprint Turf Maintenance LINK
Sprinturf provides a full Maintenance Manual (PDF) with practical schedules and tracking tools.
Key frequencies:
Grooming — New fields: Once a week for the first 2 months. After break-in: Approximately every 100 hours of use or at least once per month (whichever comes first). Older fields: Often reduced to monthly or as needed, with more focus on debris cleaning.
Infill redistribution — As needed in high-traffic areas (brush back into place).
Cleaning/debris removal — As needed (walk-throughs or mechanical sweeping).
Inspections — Regular (pay special attention to seams, lines, and infill levels).
They include:
A Routine Maintenance Log (tabular sheets with columns for Date, Type of Maintenance — e.g., Cleaning, Grooming, Snow Removal, Other — and Notes). Multiple blank log pages are provided for ongoing tracking.
A Weekly Field Maintenance Checklist (rules and quick tasks).
SprintCare professional maintenance program (includes infill cleaning/redistribution, brushing, full inspection, Gmax testing, infill depth testing, and a written report).